
Meta Ads Video Metrics That Actually Predict ROAS (Ignore the Rest)
Most media buyers optimize video ads on CPC or CPM and wonder why ROAS stays flat. Those surface metrics tell you what Meta charged, not whether the creative actually held attention long enough to convert. The numbers that predict ROAS live deeper in Ads Manager: hook rate, hold rate, 3-second views, and the video drop-off curve.
If your hook rate is below 25%, the rest of the video barely matters. Meta throttles distribution on low-engagement creative and your CPA climbs. Learn to read these metrics, test against them, and you can predict which ads will scale before you spend real budget.
Teams using AI ad performance and creative for fashion eCommerce consolidate creative testing, budget pacing, and cross-channel reporting so Meta campaigns improve without manual spreadsheet work.
The video metrics that actually predict ROAS
CPC measures clicks, not attention. A video ad can generate cheap clicks from people who tap accidentally and never watch. CPM measures distribution cost, but Meta charges less CPM to ads that hold attention, so a low CPM might just mean the algorithm already gave up on your creative. Video ads are a two-stage funnel inside a single asset. Stage one is the hook: did the viewer stop scrolling? Stage two is the hold: did they stay long enough to understand the offer? ROAS depends on both. Optimizing click cost without measuring watch behavior is like judging a storefront by foot traffic without tracking who actually walks in.
Measuring hook rate in Meta Ads Manager
Hook rate is the percentage of video plays that reach at least 3 seconds. In Ads Manager, add the columns "3-Second Video Plays" and "Video Plays." Divide 3-second plays by total plays to get hook rate. For Reels and Stories, aim for 30% or higher in prospecting. Below 20% means the opening frame is not stopping the scroll. The first frame is a distinct creative asset. Test five hooks against one winning body. A pattern interrupt, bold text overlay, or unexpected movement in the first 0.5 seconds can lift hook rate by 30 to 40%. Same product demo, different opening two seconds. That is the highest-leverage test in video advertising.
"Video ads with a hook rate above 35% achieve 2 to 4x higher ROAS than ads below 20%, even when total view count is identical. The first 3 seconds determine whether Meta's algorithm treats your ad as quality content."
- Wistia, State of Video Marketing (2025)
Reading hold rate and linking it to conversions
Hold rate measures viewers who watch past 15 seconds. Add "ThruPlays" or "Video Plays at 25%" alongside your 3-second column. A strong hook with a weak hold means your opening promises something the body does not deliver. Viewers feel baited and leave.
Ads with hold rates above 15% typically convert at lower CPA in e-commerce prospecting. The viewer had enough time to see the product, understand the value proposition, and reach the CTA. If hold rate is low but hook rate is high, fix the middle of the video before touching the hook again.
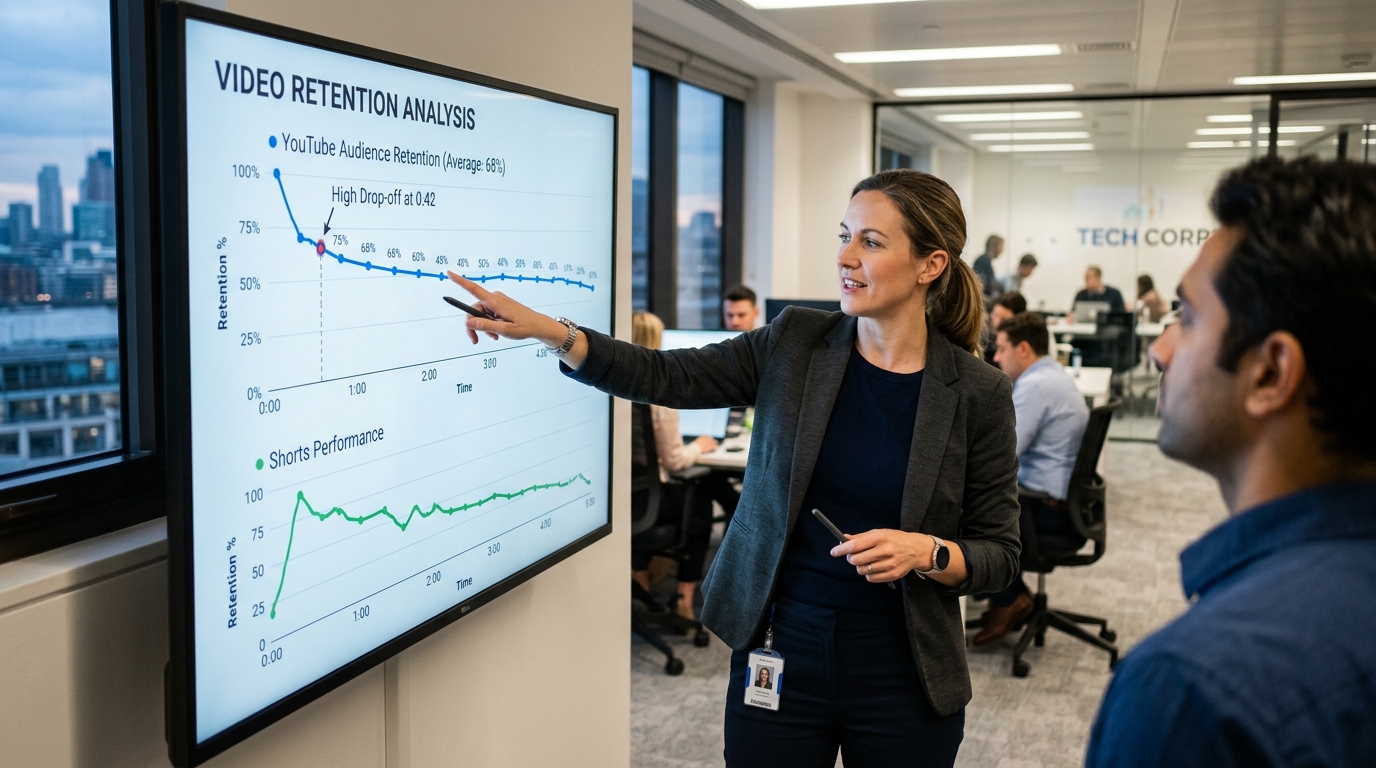
Reading the video drop-off graph step by step
In Ads Manager, click any video ad and open the video performance chart. You will see a retention curve showing what percentage of viewers remain at each second. Steep drops at second 2 mean the hook failed. Drops at second 8 often indicate a slow transition or too much setup before the product appears.
Use drop-off timestamps as a testing brief. If 40% of viewers leave at second 5, test a version that introduces the product at second 3. If retention is flat until second 12 then cliffs, your CTA may be arriving too late. The graph turns subjective creative opinions into specific edit notes.

Video metrics to fix before scaling spend
Follow this priority order. First, get hook rate above 25% by testing opening frames. Second, push hold rate above 12% by tightening the middle and showing the product earlier. Third, check click-through rate on the CTA overlay or end card. Only then scale budget. Build a simple scorecard per ad: hook rate, hold rate, CPA, and ROAS. Sort by hook rate descending and look for ads where high engagement translates to low CPA. Those are your scale candidates. Ads with high hook but poor ROAS usually have a landing page mismatch, not a video problem.
Wrapping up
Video metrics in Meta Ads Manager are not vanity numbers. Hook rate tells you if the algorithm will distribute your ad cheaply. Hold rate tells you if viewers understood the offer. The drop-off graph tells you exactly what to fix. Optimize in that order and ROAS becomes predictable instead of accidental.
Frequently asked questions
How long before the role of video metrics in meta ads manager campaigns stabilize on Meta?
Most fashion accounts need 50+ weekly purchase events before Meta exits the learning phase. Plan two to three weeks of stable spend before judging ROAS.
What budget should a fashion brand start with for Meta ads?
Start with enough daily budget to generate 7–10 purchases per ad set per week. For many apparel brands that means $100–$300 per day on prospecting.
When should you refresh creative for fashion Meta ads?
Refresh hooks or swap in new video variants when frequency exceeds 2.5 or CPA rises 20% week over week. Weekly creative tests are standard for scaling brands.